Infrastructure·
Profiling TorchNeuron on AWS Trainium: A System-Level Guide for AI Engineers
Learn how to systematically profile and optimize PyTorch workloads on AWS Trainium using TorchNeuron's native profiling tools and Neuron Explorer.
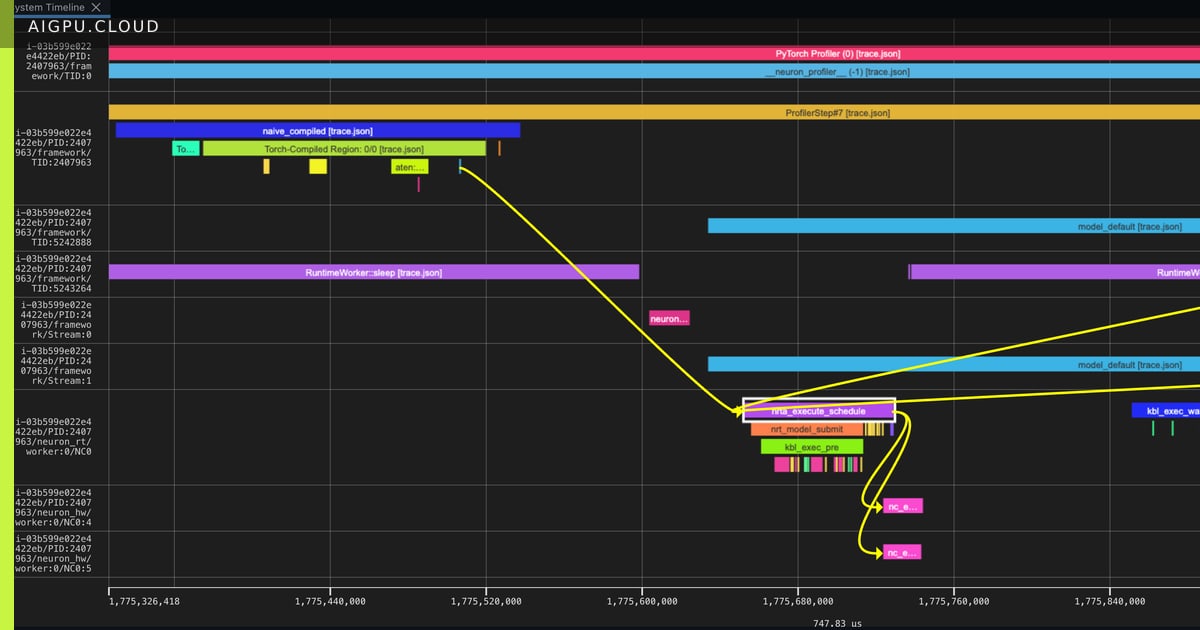
AWS Trainium has emerged as a compelling alternative for deep learning training and inference, but extracting peak performance requires visibility into where compute cycles are actually spent. The first installment of Hugging Face's profiling series walks engineers through a practical, zero-assumption workflow for instrumenting TorchNeuron workloads with torch.profiler and the Neuron backend.
From Framework Dispatch to NeuronCore Execution
The guide demonstrates how NeuronConfig and NeuronProfiler capture device instructions, runtime scheduling, and framework dispatch in a single trace. By enabling correlate_device_time, the resulting key_averages() table surfaces both CPU and Neuron device time side by side, making it trivial to spot ops that stall on the host versus those that saturate the accelerator.
Neuron Explorer then lets teams drill from a high-level timeline down to per-engine breakdowns on individual NeuronCores, confirming numerical findings with visual evidence. The post illustrates how three implementations of the same operation — eager, torch.compile, and a custom NKI kernel — shift the bottleneck profile in measurable ways.
Why it matters for GPU/AI infrastructure: As organizations diversify beyond CUDA, the ability to profile purpose-built accelerators like Trainium with familiar PyTooling reduces onboarding friction and accelerates time-to-optimization. Standardized profiling interfaces mean performance engineering skills transfer across hardware platforms, a key consideration for multi-cloud AI strategies.
- aigpu
- ai gpu
- ai gpu cloud
- aigpu dubai
- trainium
- torchneuron
- profiling
- aws
By AiGpu Editorial · Editorial rewrite based on public reporting (Hugging Face Blog)
← All articles